Usage Statistics
The Usage Statistics page provides detailed insights into your AI SmartTalk consumption, helping you understand costs, optimize usage, and track AI activity across your organization.
Accessing Usage Statistics
From the Organization page, click View Stats → on the usage overview card to access detailed statistics.
Page Overview
The statistics page is organized into several sections:
- Usage Summary Bar - Quick overview of resource consumption
- Period Metrics - Key usage indicators
- Cost Breakdown - Where your AI credits go
- Traceability - Link costs to sources
- Daily Usage Chart - Consumption over time
- Recent Activity - Detailed action log
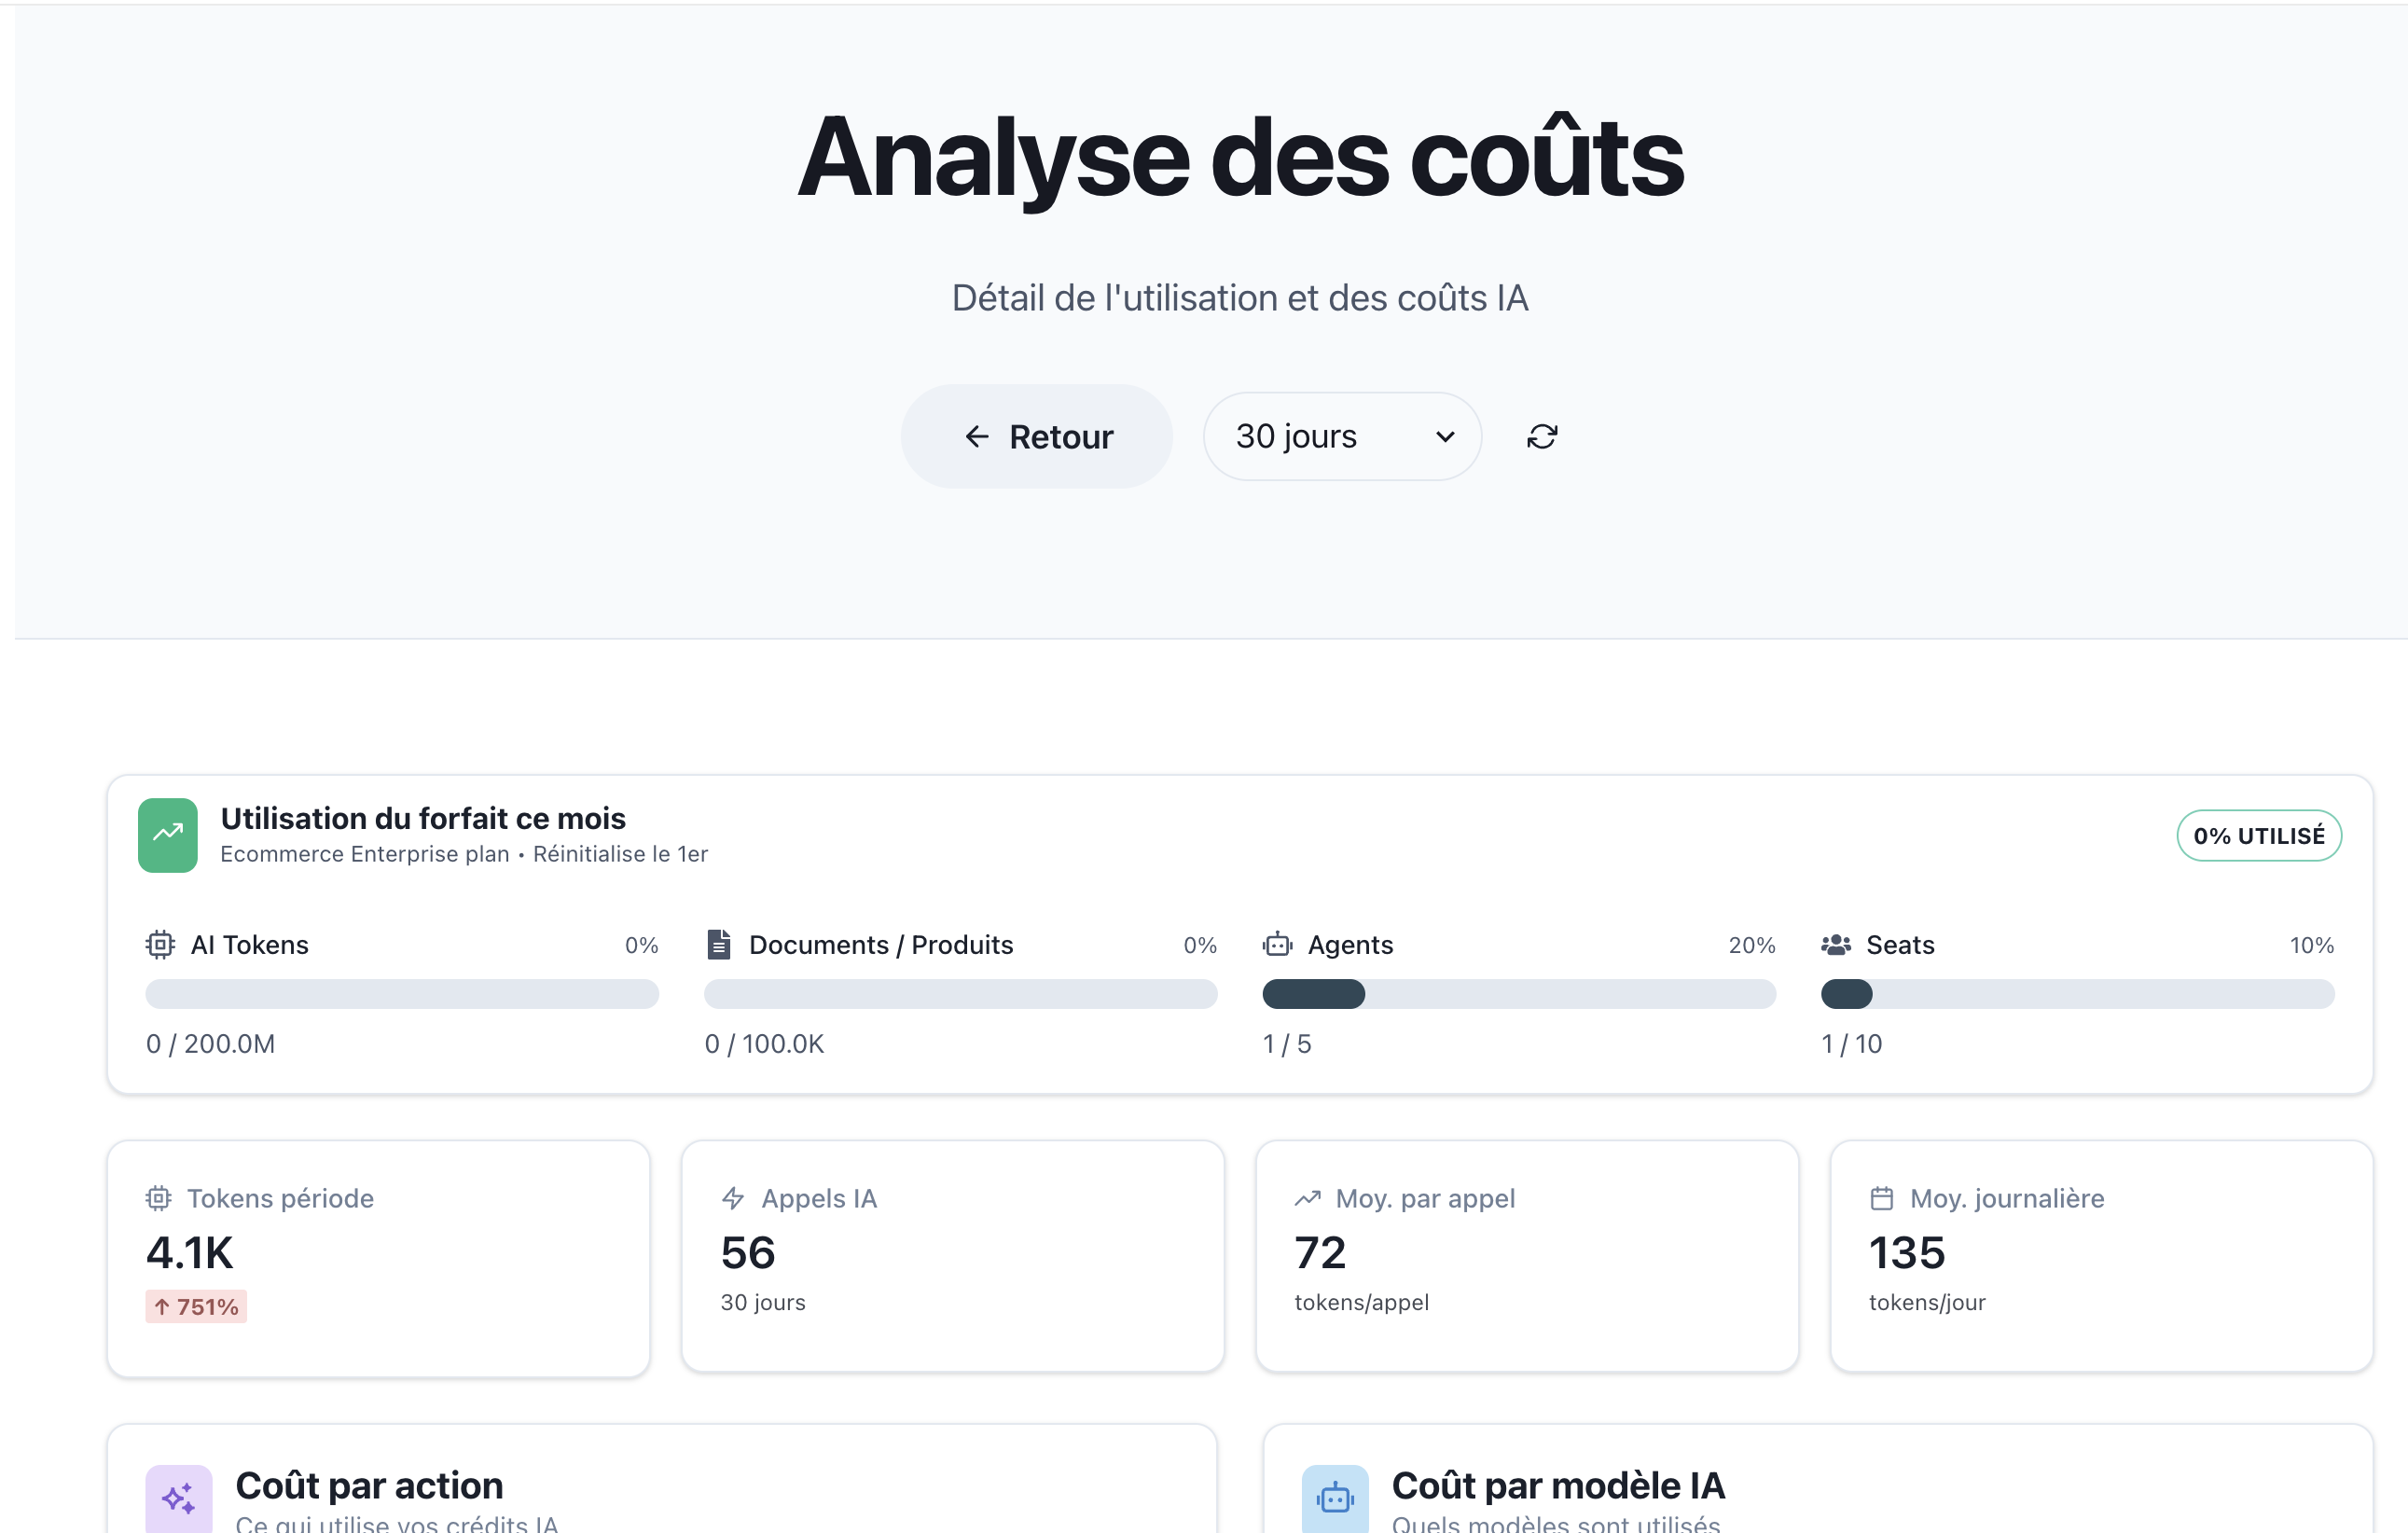
Usage Summary Bar
At the top of the page, the same usage bar from the Organization overview displays your current consumption:
| Metric | Description | Example |
|---|---|---|
| AI Tokens | Total tokens consumed | 0 / 200.0M (0%) |
| Documents / Products | Indexed items | 0 / 100.0K (0%) |
| Agents | Active assistants | 1 / 5 (20%) |
| Seats | Team members | 1 / 10 (10%) |
Period Metrics
Four cards display key metrics for the current billing period:
Tokens This Period
| Field | Description |
|---|---|
| Value | Total tokens consumed (e.g., "4.1K") |
| Trend | Percentage change from previous period (e.g., "↑ 751%") |
The trend indicator shows:
- ↑ Green: Increase from previous period
- ↓ Red: Decrease from previous period
AI Calls
| Field | Description |
|---|---|
| Value | Number of AI API calls (e.g., "56") |
| Period | Time range (e.g., "30 days") |
Average Per Call
| Field | Description |
|---|---|
| Value | Average tokens per AI call (e.g., "72") |
| Unit | "tokens/call" |
Daily Average
| Field | Description |
|---|---|
| Value | Average daily token consumption (e.g., "135") |
| Unit | "tokens/day" |
Cost by Action
This section breaks down token consumption by action type, helping you understand what drives your AI usage.
Action Types
| Action | Description | Example |
|---|---|---|
| 💬 Chatbot | Tokens used by chat conversations | 2.2K (55%) |
| ⚡ Workflow | Tokens consumed by SmartFlow automations | 1.2K (30%) |
| 🔄 Client Embeddings | Tokens for document processing and indexing | 624 (15%) |
Reading the Chart
Each action shows:
- Icon: Visual identifier for the action type
- Name: Action category
- Token Count: Absolute number of tokens
- Percentage: Share of total consumption
- Progress Bar: Visual representation (color-coded)
Color coding:
- 🔴 Red: Chatbot interactions
- 🟠 Orange: Workflow automations
- 🟡 Yellow: Embeddings and processing
Cost by AI Model
Understand which AI models are consuming your tokens:
Model Breakdown
| Model | Description | Example |
|---|---|---|
| GPT4O_MINI | OpenAI's efficient GPT-4 model | 3.4K (85%) |
| OPENAI_ADA | Embedding model for document processing | 624 (15%) |
Model Characteristics
| Model | Use Case | Cost Efficiency |
|---|---|---|
| GPT4O_MINI | Conversations, AI responses | Balanced |
| OPENAI_ADA | Document embeddings, search | High efficiency |
| GPT4O | Complex reasoning tasks | Premium |
| Claude | Advanced analysis | Premium |
Traceability
The traceability section shows how well costs can be attributed to specific sources:
Source Types
| Source | Description | Example |
|---|---|---|
| 🔗 SmartFlows | Costs linked to specific workflows | 6 (11%) |
| 💬 Messages | Costs attributed to chat messages | 8 (14%) |
| 📧 Chats | Costs tracked to conversation sessions | 54 (96%) |
Understanding Traceability
High traceability percentages indicate:
- Well-structured workflows
- Proper tagging and attribution
- Easy cost analysis and optimization
Low traceability may suggest:
- Background processing tasks
- System maintenance operations
- Untagged automated actions
Daily Usage Chart
A line chart visualizes token consumption over time:
Chart Features
| Element | Description |
|---|---|
| X-Axis | Date range (e.g., "11 Dec" to "17 Dec") |
| Y-Axis | Token count scale (e.g., 0 to 2.4K) |
| Line | Daily consumption trend |
| Area | Filled area under the curve for visual clarity |
Reading the Chart
- Peaks: High-activity days (product launches, campaigns)
- Valleys: Low-activity periods (weekends, off-hours)
- Trends: Overall consumption direction
Chart Insights
Use the chart to:
- Identify usage patterns
- Plan for capacity
- Detect anomalies
- Optimize scheduling
Recent Activity
The activity table provides a detailed log of all AI operations:
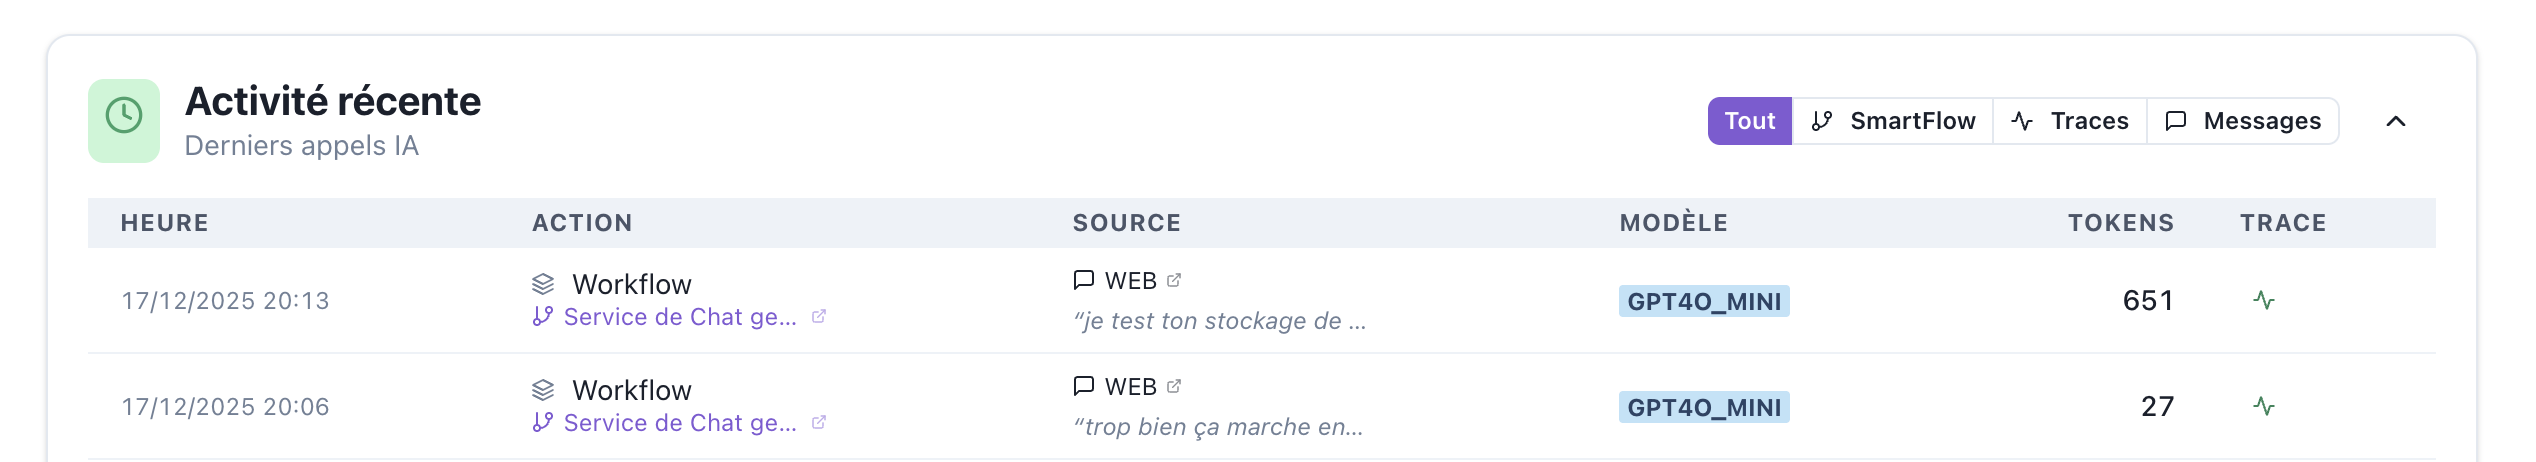
Table Columns
| Column | Description |
|---|---|
| Time | Timestamp of the action (e.g., "17/12/2025 20:13") |
| Action | Type of operation (Workflow, Chatbot, etc.) |
| Source | Origin of the request with link |
| Model | AI model used |
| Tokens | Tokens consumed |
| Trace | Link to detailed trace |
Activity Filters
Filter the activity log by type:
| Filter | Shows |
|---|---|
| All | All activity types |
| SmartFlow | Workflow executions only |
| Traces | Traced operations |
| Messages | Chat messages only |
Action Details
Click on an action row to see:
- Full request/response content
- Execution duration
- Error details (if any)
- Related actions
Trace Links
The ↗️ Trace icon opens the full execution trace, showing:
- Complete workflow path
- Step-by-step execution
- Variable values
- Performance metrics
Exporting Data
Available Exports
| Format | Contains |
|---|---|
| CSV | Raw activity data |
| Formatted usage report | |
| API | Programmatic access |
Export Use Cases
- Accounting and invoicing
- Performance analysis
- Compliance reporting
- Capacity planning
Optimization Tips
Reducing Token Consumption
| Strategy | Impact |
|---|---|
| Use efficient AI models | Choose GPT4O_MINI over GPT4O when possible |
| Optimize prompts | Shorter, clearer prompts use fewer tokens |
| Cache common responses | Reduce redundant AI calls |
| Batch operations | Combine multiple requests |
Improving Traceability
| Strategy | Benefit |
|---|---|
| Tag workflows | Easy cost attribution |
| Use conversation context | Link related actions |
| Enable logging | Complete audit trail |
Monitoring Best Practices
- Set alerts for unusual consumption spikes
- Review weekly to catch trends early
- Compare periods to understand growth
- Analyze by model to optimize costs
Troubleshooting
High Token Usage
| Symptom | Possible Cause | Solution |
|---|---|---|
| Sudden spike | Loop in workflow | Check SmartFlow for infinite loops |
| Gradual increase | Growing user base | Consider upgrading plan |
| Consistent high | Inefficient prompts | Optimize AI configurations |
Missing Activity
| Issue | Solution |
|---|---|
| Activity not showing | Check date range filter |
| Incomplete data | Wait for data sync (up to 5 minutes) |
| Zero consumption | Verify assistant is active |
Incorrect Attribution
| Issue | Solution |
|---|---|
| Untraced costs | Add workflow tags |
| Wrong source | Check integration configuration |
Related Documentation
- Organization Overview - Main organization dashboard
- Subscription Management - Plan and billing
- SmartFlow Introduction - Understand workflows
- Configuration - Optimize AI settings
- Unified Dashboard - Single inbox and analytics overview
- Pricing & Plans - Understanding plans and token allocation